Tuesday, July 6, 2010

Stop SQL Agent when enabling Service Broker on msdb

I forget this every time I set up a new server.

When I set up database mail on anew server I usually get the message “Service Broker is not enabled on msdb. Do you want to enable it?” Clicking OK gives me an unresponsive SQL server. Running the command “ALTER DATABASE msdb SET Enable_Broker” runs forever with no message returned.

What I forget each and every time is that the SQL Agent is running. Checking the locks or running sp_who2 shows that my ALTER DATABASE is blocked by the process running the Agent. Simply stopping the Agent allows the statement to finish, whether from the query window or clicking OK in the dialog box mentioned earlier. Then I just restart the Agent and everything’s hunky-dory again.

Maybe now I’ll remember it.

Monday, July 5, 2010

My favorite SQL features

Recently I ran across a contest sponsored by Microsoft SQL Server MVP Ken Simmons (Blog | Twitter). One of the ways to enter the contest was to create a blog post listing favorite SQL features. But how do you select a favorite? That’s like asking someone to choose a favorite song. Like most things the the SQL world, the correct answer is “it depends”, usually on what I’m trying to do at the time.

So here’s my top 10 favorite SQL features and tips, in the order that they come to mind. I’m ignoring features I’m not currently using, like backup compression and data encryption, and limiting myself to those I use the most often.

  1. Integration with PowerShell. This is a great feature to administer multiple SQL instances easily. For those who haven’t been on the internet in the last few years, PowerShell is Microsoft’s new scripting language based on the .NET framework. And starting with SQL 2008, PowerShell became integrated with SQL. What does this mean to you as a DBA? Well, imagine yourself as the new head DBA for your company, and you’re now in charge of 100 SQL instances. Your boss tells you that your first task is to standardize all instances. How can you quickly view the properties of each server? With PowerShell and remoting, you can easily query each instance and save the results to an Excel spreadsheet for easy analysis. I gave an example of how I do it in an earlier blog post here.      
  2. Dynamic Management Views and Functions (DMV). Introduced with SQL 2005, DMVs are a great way to see how your server is performing. I’m not going to go into them in depth here since they’ve been written about by many others much better than I can. If you’re not familiar with them, do yourself a favor and start reading about them. They’ll make your life much easier.
  3. Storing queries in the toolbox. Like all DBAs, I’ve got a number of queries that I run over and over again. There’s numerous ways to store these for easy access, but my favorite for short one-line queries is to store them on the toolbox. Simply open the toolbox (Ctrl + Alt + x) and drag your query over. To recall it, open the toolbox, copy the desired query, and paste it into a new query window.
  4. Policies. Introduced in SQL 2008, Policy Based Management allows DBAs to manage multiple servers from a central server. Policies can standardize server configurations and check them for compliance.   
  5. Report Services. Built-in reporting capabilities for the same price as the database engine. ‘nuff said.
  6. IntelliSense. This feature gives the same statement completion that you see in Visual Studio, not surprising since SQL Management Studio uses the same IDE and Visual Studio. Unfortunately it doesn’t work against 2005 servers or earlier. It did in the earlier betas but was removed in the final release. Hopefully Microsoft will put it back.
  7. Object Explorer Details. You can now see details of different database objects using the details view (F7). It’s also configurable. Just right click on the screen and choose what columns you want to see.    image   
  8. Running queries against multiple instances. If you set up Registered Groups and register SQL instances by groups, you can execute a query against all servers in the group. You can select all groups, but you can’t choose to ignore instances inside the group. It’s all or nothing. But still, a significant timesaver when you need to run multiple statements against multiple instances.  
  9. Setting variable values. One of the nice things in the .NET world is the ability to use easily change the value of a variable; i += 1 for instance. Now you can do that in SQL too. Instead of 
  10. SET @i = @i + 1


    you can now do it like this 


    SET @i += 1


  11. SQL Community. Not technically part of SQL itself, but I feel it’s important nevertheless. I first began learning about SQL on my own and quickly found myself overwhelmed. There was no time to learn at work, and I needed to find the knowledge to do my job. I found the Chicago SQL User Group and found what I needed; experienced DBAs volunteering to talk about a subject they love. ChiSUG lead me to PASS, an international group with tons of free resources. I began following blogs written by the same people authoring the articles on PASS and presenting at the group meetings. Reading these blogs lead me to twitter, where I can follow SQL experts in real-time and ask for help with the #SQLhelp tag. Finally there’s SQL Saturdays, day-long events with SQL experts speaking on various topics. Notice the recurring theme about these resources; they are all free. I’m constantly amazed by the amount of content that SQL DBAs and developers make available for no cost, and the time they put in as volunteers at in-person events. To the entire SQL community, thank you. I wouldn’t be where I am today without your help. 

Tuesday, June 29, 2010

PIVOT compared to CASE for a crosstab result

Yesterday I was playing with a test query for a coworker using the PIVOT keyword when it dawned on me that I never compared it to using CASE statements. So, here’s the requirements.

There is a table called lab_results, with a partial DDL statement below

CREATE TABLE [dbo].[lab_results](
[lab_result_id] [char](12) NOT NULL,
[patient_id] [char](8) NOT NULL,
[test_code] [numeric](4, 0) NOT NULL,
[sample_date] [datetime] NULL,
.............................
.............................
CONSTRAINT [PK_lab_results] PRIMARY KEY CLUSTERED
(
[lab_result_id] ASC
) ON [PRIMARY]

CREATE NONCLUSTERED INDEX [IX_lab_results_3] ON [dbo].[lab_results]
(
[test_code] ASC,
[sample_date] ASC
) ON [Secondary]


This table has approximately 18 million rows, and you need to get a count of test codes during each year. Anything prior to 1/1/2006 would be counted together. The data would look something like this


image 


Prior to SQL 2005, I would use a series of CASE statements to perform a count of each test code


SELECT test_code
, SUM(CASE WHEN DATEPART(yy, sample_date) = 2010 THEN 1 END) AS [2010]
, SUM(CASE WHEN DATEPART(yy, sample_date) = 2009 THEN 1 END) AS [2009]
, SUM(CASE WHEN DATEPART(yy, sample_date) = 2008 THEN 1 END) AS [2008]
, SUM(CASE WHEN DATEPART(yy, sample_date) = 2007 THEN 1 END) AS [2007]
, SUM(CASE WHEN DATEPART(yy, sample_date) = 2006 THEN 1 END) AS [2006]
, SUM(CASE WHEN DATEPART(yy, sample_date) < 2006 THEN 1 END) AS [Pre2006]
FROM lab_results
GROUP BY test_code


Using the new (to SQL 2005 anyway) PIVOT keyword, I could rewrite the query like this


SELECT test_code, [2010], [2009], [2008], [2007], [2006], [2005] AS Pre2006
FROM
(
SELECT test_code, sample_date
, CASE WHEN DATEPART(yy, sample_date) < 2006 THEN 2005
ELSE DATEPART(yy, sample_date)
END AS LabResultYear
FROM lab_results
) AS tmp
PIVOT (COUNT(sample_date) FOR LabResultYear IN ([2010], [2009], [2008], [2007], [2006], [2005])) AS p;


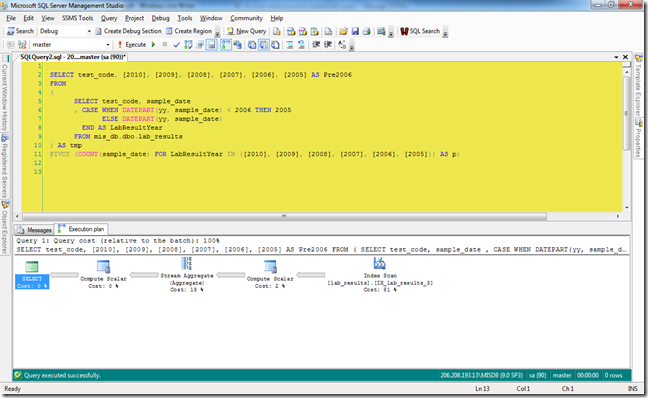
But I was never looked at the execution plan before yesterday to see how each was run. So I finally did, and here’s what I saw. First the plan for the CASE statement…


image 


…and then the plan for the PIVOT example.

 image 


At first glance they seem identical. Both are using the same operators and both are using an index seek on the non-clustered index. However there are small differences. The CASE statement completes 2 seconds faster than the PIVOT query, 45 seconds to 47. The index seek,while having an overall higher percentage of the whole, has the same operator costs as the PIVOT. The difference shows in the Stream Aggregate operator. The CASE operator is 10.8, which is 10% of the whole query. In the PIVOT example, the Stream Aggregate is 18% of the whole, and the operator cost is 19.8.


One other point about the PIVOT keyword. If you compare my code snippets to the screenshots of the executions, you’ll notice that I’m actually running against the master database and using a fully qualified name. If I ran it directly against the database where the table lives it would fail. Why? because that database, while running in on a SQL 2005 server, is still at compatibility level 7 (I know,I know). It doesn’t work unless you’re at level 9 or higher.

Monday, June 28, 2010

Report Server issues

I’ve had a lot of Report Server issues in the last few months. I thought we solved it once, only to see it come up again in a slightly different way. But I think I can put it all to bed now.

The first time was a few months ago, right when I left on vacation (isn’t that always the way?). The C drive on one of our reporting servers began to run out of space, filling up 6 – 8 GB in a matter of hours.

Before I get too far ahead of myself, let me describe our layout. We have four regional databases running SQL 2005 Standard Edition, each with data for that region. Two regions are in our corporate headquarters, the other two are in my office. We also have two SQL 2008 Standard Edition servers that run in a virtual environment, one in each datacenter. The reports hosted on each reporting center are identical except for their data sources; the corporate report server fetches data from the two corporate databases, and the local server does the same. The issue we had was on the server in the corporate datacenter.

Our first step was to check the temp files. We noticed a few small files and one massive, 8 GB file that we couldn’t delete without stopping and restarting the report service. A few hours later the massive file reappeared. All of these temp files were prefixed “RSTemp_”.

We moved the location of the temp files to a larger drive to give us more time before the largest temp file grew too large. By default the location is on C:\Program Files\Microsoft SQL Server\MSRS10.<<Instance Name>>\Reporting Services. You can change it by modifying the rsreportserver.config file and adding the entry to the <Service> tag:

    <Service>
---
<FileShareStorageLocation>
<Path>I:\RSTempFiles</Path>
</FileShareStorageLocation>

</Service>


That gave us extra space, but it didn’t solve the issue. A little more digging showed that we had a long running report that was also getting bad data. The query for the report was looking for a scalar value but was returning multiples. The query was also a long running query. What we found was happening was that the report execution was timing out, but the query was still active. The user didn’t see the timeout and constantly tried to re-run the report. Consequently this report was continuously paged out to disk, and it never died. Once we cleaned up the data and fixed the reports query, the problem hasn’t reappeared.


The next issue was related to performance. We noticed at certain times of day the report server would get really sluggish. Reports that would complete in 10 seconds would now take 10 minutes. Looking at the server resources showed no increase in CPU, IO, or memory usage. We didn’t see a repeat of the super-big temp file, though there was an increase in the number of temp files.


A little more investigation showed that, when the performance began to degrade, there were locks being held by one process clearing the sessions that blocked another process that was writing session data. We were finally able to track this to a third party application we use to monitor performance. It didn’t look like the software was configured properly.


In investigating both of these issues we looked at the data in the ExecutionLogStorage table in the ReportServer database. If you’re not familiar with this table, you should check out Robert Bruckner’s excellent post on ExecutionLog2 View - Analyzing and Optimizing Reports.


In the first issue, we were able to identify the report by seeing the pagination values in the additional information data. In the second, we could spot when the slowness would begin by seeing the TimeProcessing values rise.         

Friday, May 14, 2010

Catching up

Nothing SQL related in this post, just clearing my mind and catching up.

First, my laptop went kablooie a few weeks back. I've been using a Pavilion TX 2000 that I ordered custom from HP for the past few years. I chose this model because I wanted a computer that could run the old Tablet XP OS, and I loved the swivel top that let me use it as either a notepad or as a full blown laptop (Apple, you need to add the ability to write on the iPad). Anyway, a few weeks ago my pc wouldn't boot at all, just kept giving me a black screen. I couldn't even get to the BIOS screen or boot from a CD. Luckily I had also bought an extended warranty that was still in effect. So, after opening a ticket with HP, I shipped the unit back to them, and they had it back to me about 10 days later. I was without the laptop for about 2 1/2 weeks, of which 1 was vacation time anyway. And not counting the week between when the unit first went bad and I shipped it back, I hardly missed it.

But I did miss it. I work mostly on my laptop at work and on my commute. This is my lab, where I can install my own programs and other beta apps. It's also the machine I blog from, mostly while on my commute. So it's good to have it back. I'm just finishing installing SQL 2008 R2, VS 2010, and Office 2010. I should be good to go by the time I go back to work on Monday.

Speaking about work, I did mention that I'm just finishing up a two-week vacation. The first week my wife and I took a cruise to the Mexican Riviera. We had a wonderful time. Perfect weather, great scenery, wonderful people. I'd like to go back soon and see some of the sights we missed this time around. This second week is just relaxing, doing yard work, mostly taking it easy.

Next week I'll write about an issue I ran across with our report server just before I left.

Thursday, April 15, 2010

What I learned tonight – tempdb size when SQL starts

I went to the April monthly meeting of the Chicago SQL Server User Group tonight to see Brad McGehee (Blog | Twitter). Brad’s in town to present at SQLSaturday # 31 in Chicago and he also gave a talk to us tonight on optimizing tempdb performance.

It was a good session because it went over tempdb and best practices. Most of the information I already knew but it’s always good to hear it again, even as a refresher. And there’s usually something I took for granted but was wrong about. And tonight was no exception.

I knew that the data and log files for tempdb are recreated when the SQL service starts. But I thought that tempdb got it’s db options from the model database. For instance, if the model database is set at 2 MB for the data and 1 MB for the log then tempdb would inherit those same settings. But i was wrong. As Brad mentioned tonight, tempdb starts out as 8 MB for the data and the log file is 1 MB. On my laptop its’s actually 512 KB but maybe I heard him wrong.

Anyway, to properly resize tempdb you should run the ALTER DATABASE command…

USE master;
GO

ALTER DATABASE tempdb
MODIFY FILE ( NAME = 'tempdev', SIZE = 25600KB , FILEGROWTH = 5120KB );
GO

ALTER DATABASE tempdb
MODIFY FILE ( NAME = 'templog', SIZE = 2048KB , FILEGROWTH = 1024KB );
GO


…and tempdb will be correctly resized after every restart. And you’ve heard that you should create multiple tempdb files depending on the number of CPU’s you have? Well, just do that at the same time. Here I’m renaming, moving, resizing, and adding a file to tempdb; 


USE master;
GO

ALTER DATABASE tempdb
MODIFY FILE (NAME = 'tempdev', NEWNAME = 'tempdev1', FILENAME = 'C:\SQL2008\DATA\tempdev1.mdf');
GO

ALTER DATABASE tempdb
MODIFY FILE (NAME = 'templog', FILENAME = 'C:\SQL2008\DATA\templog.ldf');
GO

ALTER DATABASE tempdb
MODIFY FILE (NAME = 'tempdev1', SIZE = 25600KB , FILEGROWTH = 5120KB);
GO

ALTER DATABASE tempdb
MODIFY FILE (NAME = 'templog', SIZE = 2048KB , FILEGROWTH = 1024KB);
GO

ALTER DATABASE tempdb
ADD FILE (NAME = 'tempdev2',
FILENAME = 'C:\SQL2008\DATA\tempdev2.ndf',
SIZE = 25600KB , FILEGROWTH = 5120KB);
GO


The usual disclaimers go here. Don’t use this script without understanding it as it can screw up your server. Don’t use it in production until you’ve testes it.


And I’ll leave the discussion of multiple tempdb files for now.


Tuesday, April 13, 2010

SQL error log finds all copies of resource db after moving db

Just a short post about something interesting I saw in the SQL error log a while back.

A while ago, I moved the system databases off the C drive’s of our servers to another drive on the SAN. That included moving the resource database. You can read Microsoft’s recommendations on moving system db’s on MSDN.

Anyway, I copied the mssqlsystemresource.mdf and mssqlsystemresource.ldf files to a backup location in case of an emergency. But only one database was attached. 

This interesting entry in the SQL error log was after I restarted the server:

The resource database has been detected in two different locations. Attaching the resource database in the same directory as the master database at 'O:\SQL2005\DATA\master.mdf' instead of the currently attached resource database at 'O:\SQL2005\Data\mssqlsystemresource.mdf'.

So, SQL saw both the attached db and the unattached backup copy when I restarted the service. The only time I saw the message was the first reboot, not any subsequent restarts.